Introduction
In February 2004, at Harvard University, a student created a website allowing other students to discuss, exchange ideas, publish their best jokes. This small project quickly spread to the campus, then to other universities, and finally to the whole world. This is how Mark Zuckerberg became a billionaire in a few years. However, like any famous person, he is often exposed to a lot of criticism, especially in recent years. It is important that each person can express himself freely by giving his opinion on the decisions and actions of multinationals. By relaying these opinions in the media, it not only allows the company to get honest and constructive feedback, but also transmits the information to the customers or users, who might suffer the consequences. But do these reviews have a real impact on the financial health of the company?
In this article, we will analyze quotes from 2015 to 2020 from the Quotebank dataset to determine positive and negative thoughts about Mark Zuckerberg and his companies. Next, we will profile the types of people issuing these quotes and analyze their tendencies to speak kindly or unfavorably about Mark Zuckerberg. Finally, for each of these people categories, we will determine if the impact of these positive and negative reviews is significant on Facebook’s stock numbers over time.
Data
We use the subset of quotes talking about Mark Zuckerberg and his companies from the QuoteBank dataset which contains quotes made in English-speaking news articles published between 2015 and 2020. These quotes are coupled with a dump of Wikidata containing information about their author. To measure the success of Mark Zuckerberg, we use the stock price of his company Meta on the Nasdaq Stock Market during the same period.
Sentiment analysis
Global result
To assign a sentiment to each quote, we first use a pre-existing sentiment analyser that will output a score, referred to as the compound score, in the [-1,1] interval. If the score is close to 1, it means that the quote conveys a very positive sentiment whereas a score close to -1 indicates a very negative meaning. Therefore, we assign a sentiment label to each quote by thresholding the compound score. We began by doing an overall analysis of sentiment over time. Specifically, we look at the proportions of each sentiment (positive, negative, neutral) during each week.
The majority of quotes are positive (or neutral), henceforth negative quotes represent only a small fraction of all the quotes in a given week. We also observe that the proportion of positive quotes decreases slightly around 2018-2019, negative quotes were increasing at the same time. This corresponds to the period when the Cambridge analytica scandal was revealed extensively in the media.
To finish with the overall inspection, we noticed that the number of quotes is not consistent over time. The first observation is this high spike in early 2018. As already explained earlier, that’s when the Cambridge Analytica scandal exploded in the media, therefore it makes sense that the number of quotes is also scaling up. There are also some periods form 2015 to the start of 2017 were there isn’t much data, due to the Quotebank dataset having only a few quotes during theses intervals.
Clustering
If we look at the mean compound score described in sentiment analysis, by considering the sentiments of all the people talking about Mark Zuckerberg simultaneously, this doesn’t give much information.
To overcome this problem, we thought that it might be interesting to split the people into different clusters, based on different personal characteristics, to see if we can spot trends where some groups of people talk more positively or negatively about Mark Zuckerberg or Facebook.
Clustering on ages
The first idea for clustering people we came up with is to separate people based on their ages at the moment when the quote was made. Our a priori thought is that younger people should talk more positively about Facebook or his creator as they are more susceptible to use the social network in a daily basis whereas older people might be more suspicious about this “new technology”.
To see if this hypothesis is verified or not, let’s look at the data and what they tell us. We choose to arbitrarily split the dataset into 4 different ranges of ages: [0,25], [26-50], [51-75] and [76-125]. We start to analyse the split on ages by looking at what proportion of the quotes each category represents.
According to the plot above, we can see that people between 26 and 50 years are the ones making most of the quotes about Mark and Facebook. Indeed, by looking at the data, we can see that they represent around 50% of the quotes over time. Then come people from 51 to 75 years with around 30% of the quotes.
Let us now have a look at the evolution of the mean compound score of each age category over time.
From the first plot above, we can see that in general the category [0, 25] tends to speak in a more positive way than any other categories. This visual difference is in fact verified by looking at the box plot about the mean compound score. It can also be shown that this difference is indeed statistically significant at level 5%. The second thing we can read from the first plot is that the category [51-75] tends to speak more negatively about Mark or Facebook, than any other category of ages. Again, this difference can be shown to be statistically significant.
We can also see two big spikes to low scores in the plot about the mean compound score. The first one is not very significant since it is caused by only 2 persons. The second spike, on the other hand, corresponds to the [0-25] category and occurred in November 2016. Although that it is only caused by 14 people, it is known that Quotebank collect almost no data during this period of time. Furthermore, it is also known that, at that point in time, severals reports show that Cambridge Analytica used personal informations of 87 millions Facebook account without their consent (see Facebook - Cambridge Analytica scandal). This information would have influenced the 2016 US election, and other important events afterwards, such as the Brexit. It will later (in 2018) be revelead in the international media that Facebook have let a scientist access to an API to collect data from Facebook. We therefore think that this very low average score at that particular point in time from the younger people (maybe the more susceptible to use social networks) represents their anger toward Facebook following this scandal. And even though 14 quotes is not enough, we can suspect that at this time, most of the person using Facebook in a daily manner may feel the same way after this revelation. We will see that such a negative spike in the sentiments score for November 2016 will come back several times during our analyses.
Clustering based on gender
Let us now look at the quotes by analysing them from a gender perspective. Among the quoters of Mark Zuckerberg, there are a lot of different genders. To be precise, we get exactly 18 different genders from the data. As before, let us first see the proportion of each gender over time among Mark quoters.
We choose to group genders other than men or women into the “Other” category as we suspect them to be not so represented in the data set. From the above plot, we can indeed see that even by grouping all of them into the same category, they represent about 0% of the quotes at any time, i.e. they are under-represented at any point in time. For this reason, we chose to remove them in our subsequent analyses as the results won’t have much value with such a small sample size. We can also see that we have a large bias towards men since they represent ~80% of the quotes at any point in time.
By looking at the mean compound score, the first thing that stands out is that the curve for the women tends to be above the curve of men almost all the time. The only exception is in November 2016 where the small number of quotes we have from women at this date gives us the overall lowest mean compound score of all time. Again, this date corresponds to when Facebook data was used by Cambridge Analytica to help Donald Trump’s election. However, men and women tend to be mostly neutral (or a bit biased toward positive) over time. The mean compound score for the two groups is shown in the box plot and we can see that women have a mean score a bit higher (difference of 0.07) than men over the whole period of time. The difference in the sentiment score between the men and women is statistically significant at level 5%.
Clustering based on continent
Do the Europeans tend to speak more positively than the Americans ? Or maybe, do the Asians have a tendency to give a more negative opinion about Mark Zuckerberg and/or Facebook ? That’s the kind of questions we will try to answer by clustering people with respect to their continents. As before, let us start by inspecting the number of data we have for each continent.
It is absolutely not surprising to see that Americans gather almost 60% of the quotes at any time since, as explained in the introduction, the data mostly come from American newspapers which are more likely to speak about the actuality of their country.
After the Americans, come the Europeans with around 20% of the quotes. An interesting thing is, despite being the continent with the largest population, Asia comes only in the third place with respect to the proportion of quotes made. It is even worse for Africa which is the second continent in terms of population but that comes in last position on the proportion of the quotes ladder. We can see that much our data set is biased towards European and American.
In terms of mean compound score, we can see that there is no continent which seems to be always more positive than the others. The spikes we can see in the plot are only caused by one quote which means that we cannot conclude anything interesting. On the other hand, over the whole period of time, it seems that Asia speaks a bit more negatively about Mark and Facebook. From the last plot, we can see that the above intuition about Asia is confirmed as they have a mean compound score statistically lower than the other continents. From this plot, we can also see that the European have spoken statistically more positively about Facebook and Mark than the others over the 5 years of news articles spanned by Quotebank.
Clustering
Our final try is to let a clustering algorithm run and see if, based only on peoples’ demographic attributes, it can create clusters grouping people talking mostly positively or negatively about Mark or Facebook in the quotes. To do so, the clustering algorithm will use demographic attributes associated to the quoter. These information were collected from Wikidata. To be more precise, in order to compute the distance between two quoters, we use their age, nationality, profession, religion and gender. The other attributes collected from Wikidata were not set in enough quoter to be able to use them. As there was a lot of quoters, we choose to oblige all the attributes to be set so that we can get a more meaniningful distance as well as reducing the number of quoters we need to process.
Finally, we force each cluster to contain at least 2’000 persons so that the size of each cluster is large enough for our subsequent analyses to be valuable. The total number of clusters found by the algorithm is 9.
Earlier in this article, we saw gender and continent characteristics at a quote level, i.e. we inspect the distribution of the quotes by continent and gender but at the quote level. Here, we change our vision and we rather look at them from a person persepective.
In the plot, we can see the different distributions of the attributes of Mark Zuckerberg quoters. We choose to only display the first 5 nationalities and occupations as the other ones gather a tiny percentages of the population. From the plot above, we can see that the most represented professions in the datasets are actors (6.22%) and politicians (7.05%). Furthermore, as already mentioned, most of the quoter comes from the United States and therefore from America which explain the two large percentages we got in the nationality and continent pie charts. We can also see that the second nationality in terms of number of quoters is the United Kingdom which explains such a high score for the Europeans. As already mentioned in this article, the number of men is much higher than the number of women.
Let’s now look in deeper details about which type of person is contained in each cluster. (Note that using the dropdown, you are able to explore each cluster)
By observing the plots above, we can see that our clustering gathers similar people together as intended and the clusters are almost all interpretable. Using the above decomposition of each cluster, we can make the following comments. In cluster 0, we can observe that it is almost exclusively composed of women which have movie and television related professions (actress and model) coming from the United States of America. In cluster 1, we got athlete men from the United States. Athletes from various sports from the United Kingdom populate cluster 2. In cluster 3, we can see that most of the quoters are men with cinema related professions from the USA and also a bit from India. Cluster 4 is perhaps the less interpretable cluster but it gathers men from the United Kingdom in majority. Cluster 5 groups mainly people with a writing related profession such as writer, screenwriter or journalist, coming from America. The three last clusters are mainly composed of politicians from the USA. However, cluster 6 is composed of women whereas the other two, which are almost indistinguishable, are composed of men.
An interesting point is that our clustering function really split men and women in disjoint clusters. Also, this analysis allows us to shed light on the fact that our dataset is also biased toward actors (or movie professions), journalist, politicians and athletes while the other professions are under-represented.
As before, we continue by searching if there is a cluster which contains more quotes than others.
The first thing we can see is that cluster 4 and 6 have in general fewer quotes than any other cluster. Then, come clusters 2,3,5,7,8. Finally, cluster 0 and 1 tend to speak more about Facebook and Mark Zuckerberg.
Our second analysis is about to find out if there is any cluster whose mean compound score is much higher than others. To facilitate comparisons, we order the clusters in decreasing mean compound score order. As shown in the boxplot below, we can see that the 4 first cluster have a much higher median for the compound score than the other clusters.
We can also see that at least half of the person in each cluster speaks non-negatively about Mark Zuckerberg. Specifically, in the first 4 clusters, we can see that this percentage is increased to 75%.
To push the analysis further, we have seen in the above description of the clusters that the first cluster is composed of women almost integrally. It is therefore expected that this cluster will get a higher mean compound score than the other since the women get in general a higher mean score (as shown before).
Another interesting fact is that cluster 6 is also mainly composed of women, and they obtain a much lower mean compound score. If we look at what is the profession of the women in cluster 6, it has been shown than they are mainly politician or journalist. As the clustering algorithm didn’t use the score to cluster the people, it is tempting to say that the politician and journalist women tends to speak more negatively than actress/mode women or women working on TV (cluster 0).
We can also notify that a similar phenomenon occurs with the men. If we take a look at the difference of the mean compound score between cluster 1 (English athletes) and clusters 7 and 8 (American politicians), we can see that there is a significant difference in their mean compound score. Overall, since we observe the same phenomenon for both men and women, it becomes more and more tempting to say that, in general, politicians (irrespective of the gender) tend to talk in a bad way about Facebook and Mark.
If we look at the mean compound score over time, it is really hard to distinguish any specific trend where everyone talks badly or in a good way about Mark or Facebook (other than the above comments). It seems that the score of every cluster is around 0.2 and doesn’t deviate too much from this value. Again, the only negative spike we have corresponds to the Cambridge Analytica scandal but corresponds to only one quote so it is not enough to draw any conclusion for cluster 2 at this point in time.
Regression analysis
How do the opinions of different groups of people in the news about Mark Zuckerberg and his companies relate to his success ? To investigate this question, we use different regression analyses. This allows us to discover if there are certain trends for a given group, whether these trends are statistically significant and how they impact his success. We see below how we can quantify this.
How can we measure the success of an entrepreneur ?
There are different possible ways to quantify the success of an entrepreneur. If we remain down to earth and do not enter philosophical discussions on what actually is success, we can imagine evaluating our person of interest, Mark Zuckerberg, by looking at his wealth over time. However, this is not always easy to do as-is since we do not have transparent access to his assets, properties and their values.
Instead, we use a “proxy” for his wealth by considering the stock price on the Nasdaq Market for a company he is well known for, Facebook, now Meta Platforms Inc. Mark Zuckerberg is the CEO and one of the founders of Meta Platforms that regroups entities such as Facebook, Instagram and Whatsapp. As the stock market is generally reactive to, for examples, scandals, new improvements on products etc, it is a reasonable way to quantify how well Mark Zuckerberg is doing. Moreover, this is a reliable source of information for the period we are treating (2015-2020) as we can easily access daily stock prices for the past years.
As said above, we consider weekly data. For the stock price, the daily opening and closing prices are averaged and then these values are averaged over each week to get a single representative price for the week. In the figure below, we have the evolution from 2015 to 2020 of this weekly average stock price. It increases steadily from 2015 until the beginning of 2018. Around March 2018, it falls. This corresponds to the period where the Cambridge Analytica scandal with Facebook exploded. So this verifies that the stock market is reactive to external events as we said above.
To relate the opinions of different groups in the news with the stock prices, we will use a simple linear regression, where the inputs are the different polarity scores and the output is the stock price. More concretely, the design matrix is built as follows. A datapoint (predictor) is the vector of average positive and negative scores over a given week as well as the number of quotes made during that week, and this for every group. What we would like to investigate is whether trends in the opinions of some groups give some indications about the futur behavior of the stock price of Meta. Therefore, for a predictor at week n, we consider the stock price at week n+1 as its response variable. Since the different features do not have the same range (positive score is between 0 and 1 but the number of quotes may be in the hundreds), we standardize the features.
Note that here the goal is not exactly to predict very accurately the stock price of the upcoming week based on the current week quotes but rather to see if there are trends among certain groups that emerges. To accurately predict the stock prices, we would probably need more complex models as well as other features. However, more complex models quickly becomes less interpretable (black-box models) and this would prevent us to interpret the trends we look for. So a simple linear regression is well suited for this task.
Regression analysis on specific attributes
Let’s look at different possible characterizations of people. Below, we consider the following one :
- Gender (named according to WikiData)
- The continent where the author comes from
- Her/his age, distributed into 4 ranges : 0-25, 26-50, 51-75 and 75+
- Using our custom clustering
The data contained many different genders. Sadly, the genders other than women/men were under-represented. This means many weeks were not containing any quotes by such authors and therefore would introduce missing data in our design matrix. So for technical reasons, we focus only on these 2 genders.
Analysis by gender
How do the different features for each group, here women and men, relate to the stock price ? Below, we have the relationship between the stock price at week n+1 and the different features at week n, as well as a regression line estimated from the given feature only. We directly observe that there is no very clear linear correlation between a feature and the price. Some predictor such as the positive mean for men even seem to be irrelevant whereas others such as the number of quotes made by women seem to exhibit a slight linear relationship.
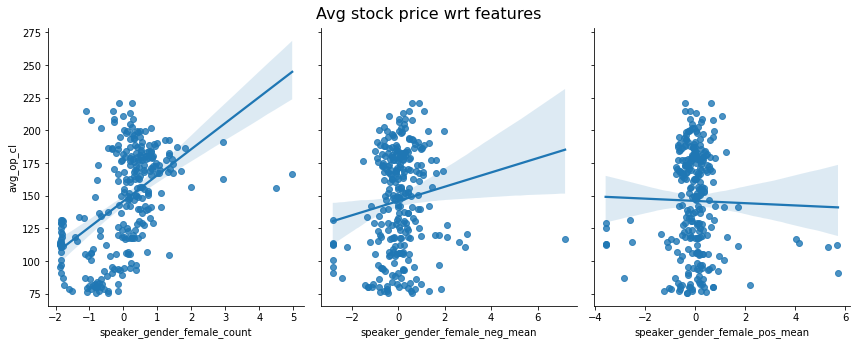
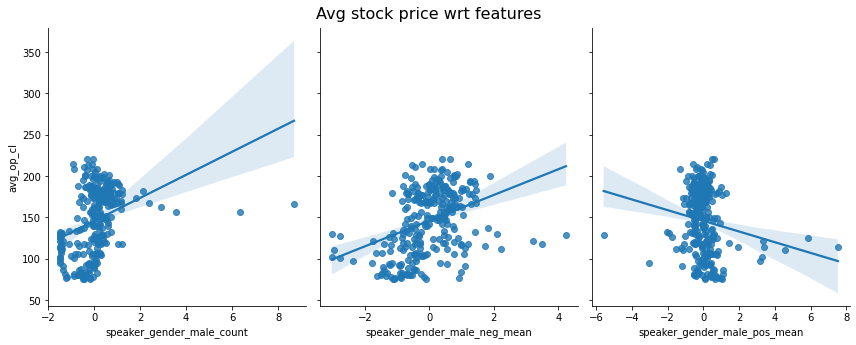
To find more accurate insights about these possible trends, consider the coefficients obtained with a linear regression taking as input all the 6 features above and as output the (delayed) average stock price. The statistically significant coefficients at level 5% are shown below in color, the others in gray. Over the 6 features, only 3 are statistically significant at level 5%. You probably imagine that if people are speaking favorably then this would have a positive effect on the stock price and vice-versa. But surprisingly, the coefficient associated to the negative sentiment for the men is positive. This means that the more negative the men quotes are the higher the stock prices tend to be. A hypothesis could be that since most of the quotes convey a rather favorable opinion they do not contain much information. However, since the pessimistic quotes are rarer, they carry a stronger signal.
Women quotes are a good sign for the price whereas the number of men quotes is a bad omen for the stock price. Indeed, the number of quotes made by men is negative whereas the one for women is positive.
Does the model fit the data well ? Our linear regression model reaches a R2 score of 0.36. So it is able to capture more variance than a constant model.
Where do they come from ?
Comparably to the analysis on genders, the plots of the stock price w.r.t. each of the features do not exhibit very clear trends, and we omit them here for clarity reasons.
Similarly to the regression on genders, the only features that matters here are the number of quotes and the negative score but the positive score is not relevant (not statistically significant at level 5%). Again, there is some contrast between the number of quotes in different groups. The more American quotes there is, the lower the price tend to be whereas the more quotes there are in Europe or Asia, the higher the price is likely to be.
As before, this fit has a R2 score of 0.33.
How old are they ?
Here we look at the different ranges of age in the authors. Namely, we consider the ranges [0-25], [26-50], [51-75], [76+]. As what was done in the two previous analysis, we do not show the plots of the relationships between the features and the stock prices since they are very similar and do not add much insights.
We don’t change a winning team… these are again the count of quotes and the negative score that matter most. However, the positive score for the 76+ authors seems to be relevant as well. But, as surprisingly as before, the corresponding coefficient is negative, meaning that the more positive the quotes are for these people, the lower the stock price tends to be.
We can also look at the magnitude of the significant coefficient for the negative scores. A larger coefficient would mean that this group is more “influential” or gives stronger indication that the stock price will be high (as they are all positive). For example here, the most relevant group would be the 26-50, which tend to be the most active and powerful in the industry in general, seem to weigh more in the behavior of the stock prices than the other 2 groups. This also reflects the fact that we have a majority of people in this range of age in our dataset.
A contrast in the count of quotes also emerges. Young people seem to be more critical in their opinions than older people. Indeed, the coefficient for the count of quotes by young people (0-25) is negative whereas the one for the older people (76+) is positive. This is in concordance with our previous analysis.
For this model, the R2 score is 0.28, so it captures more variance in the data than the constant model.
Who are they ?
Similarly to what is done for the other analyses, we omit the features plots for presentations reasons.
Clusters containing mainly women, such as clusters 0 and 6, tend to have a positive influence via their count coefficient. The count of quotes of American men is however rather negative for the stock price as we can see in clusters 1 and 5. This is what we also observed in the analyses about continents and gender.
Let’s now investigate which professions are the most impactful. We could expect that professions such as economists, politicians weigh more in the game than artists, athletes or similar. For example, consider the coefficients corresponding to the negative score of clusters 1, 5 and 7, which are statistically significant at level 5%. These clusters mainly contain American male athletes, American male journalists and American male politicians, respectively. By inspecting the magnitude of these coefficients, we can deduce that the larger ones are more important for the stock price. In our case, the most relevant profession is journalist, followed by politician and finally athlete. This is comparable to what we expected.
Conclusion
What have we learned about Mark Zuckerberg and his reputation?
First, the reviews in the newspapers are rather neutral or positive. There is still a slight average drop in the proportion of positive quotes after the Cambridge Analytica incident in 2018.
Second, we separated the quotes by different groups of people. We saw that young people under 25 tend to speak more positively about Mark Zuckerberg and people between 51 and 75 tend to speak more negatively about him.
In addition, women speak more positively than men about the billionaire. When analyzing where the authors of the quotes come from, we observed that Asians tend to be a bit more critical towards the American giant, while Europeans are on average more favorable.
We also saw that grouping data by similar demographic values can reveal differences in overall sentiments. For example, American politicians are less positive than British athletes.
Finally, Meta’s market analysis revealed that there is an inverse correlation between the negativity of the quotes and the stock price. Therefore, talking negatively about someone will not necessarly make him less wealthy.
Robin Plumey, Alessio Verardo, Florian Constantin, Cyrille Pittet